11–246MR Attachment - ASIC data shows rise in insolvency appointments
Chart 1 — Companies entering EXAD by quarter
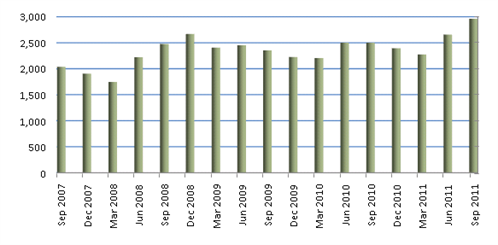
Table 1— Companies entering into EXAD by region
|
State / Territory |
Sept Qtr 2010 |
June Qtr 2011 |
Sept Qtr 2011 |
% |
% change Sept Qtr 2010 |
June Qtr 2011 |
|---|---|---|---|---|---|---|
|
NSW |
1,073 |
1,097 |
1,247 |
42.1% |
16.2% |
13.7% |
|
Vic |
667 |
706 |
719 |
24.3% |
7.8% |
1.8% |
|
Qld |
474 |
504 |
564 |
19.0% |
19.0% |
11.9% |
|
AS |
88 |
112 |
129 |
4.4% |
46.6% |
15.2% |
|
WA |
146 |
176 |
218 |
7.4% |
49.3% |
23.9% |
|
Tas |
22 |
21 |
28 |
0.9% |
27.3% |
33.3% |
|
NT |
9 |
12 |
8 |
03% |
-11.1% |
-33.3% |
|
ACT |
23 |
28 |
48 |
1.6% |
108.7% |
71.4% |
|
Total |
2,502 |
2,656 |
2,961 |
18.3% |
11.5% |
NB: ASIC notes that percentage changes in smaller regions can be unduly influenced by a relatively small number of appointments.
New South Wales (+16.2%) Victoria (+7.8%), Queensland (+19%), South Australia (+46.6%), Western Australia (+49.3%), Tasmania (+27.3%) and ACT (108.7%) recorded an increase over the same quarter in the past financial year.
Only the Northern Territory (-11.1%) experienced a decline in EXADs.
Table 2 —Companies entering into EXAD by appointment type for the quarter ended 30 September 2011*
|
|
Sept Qtr 010 |
June Qtr 2011 |
Sept Qtr 2011 |
% change Sept Qtr 2010 |
% change June Qtr 2011 |
|---|---|---|---|---|---|
|
|
727 |
683 |
913 |
25.5% |
33.7% |
|
|
1,064 |
1,228 |
1,271 |
19.5% |
3.5% |
|
|
359 |
346 |
390 |
8.6% |
12.7% |
|
|
351 |
399 |
387 |
10.3% |
-3.0% |
|
|
2,501 |
2,656 |
2,961 |
18.3% |
11.5% |
* excludes: scheme administrator and foreign/RAB wind-ups; and members voluntary liquidation appointments as these relate to solvent entities
Includes:
(1) provisional liquidations, and
(2) receivers, receivers and managers, controllers and managing controllers.
View the full monthly insolvency statistics
Back to 11-246MR