Reportable situations data dashboard
Welcome to the reportable situations dashboard
How to use the dashboard
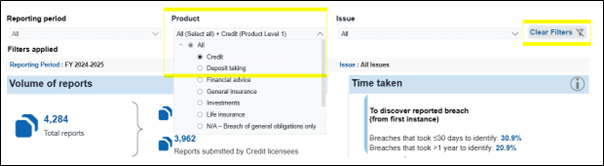
Page filters
You can apply filters using the drop-down options at the top of each page. Only one value from each filter can be selected at a time.
The filters selected on one page are applied to the other dashboard pages. Click ‘Clear filters’ to reset all filters on the dashboard.
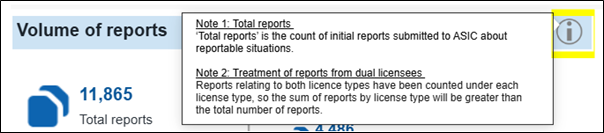
Information icons
Hover over information icons to view details about how to interpret the data or use the charts.
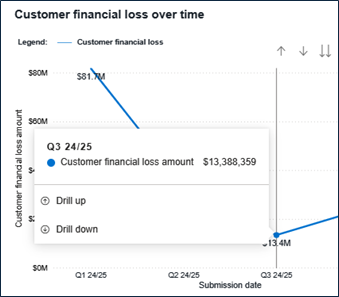
Tooltips
Hover over the data points in a chart to view information about them.
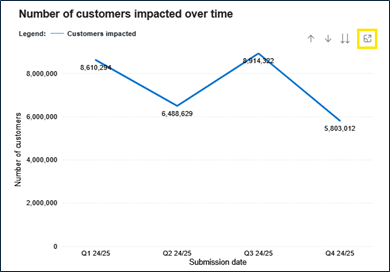
Focus mode
Hover over a chart and click on the focus mode icon in the top right to enlarge it.
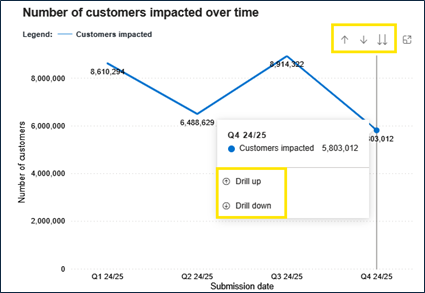
Drill mode for over time charts
Change between monthly, quarterly and yearly data in charts which show trends over time by hovering over the chart and using the arrows at the top right or the drill up/down buttons in the tool tips.
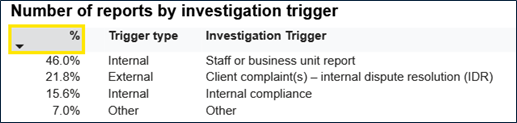
Sort function
Reorder tables using the sort button available on each column header.
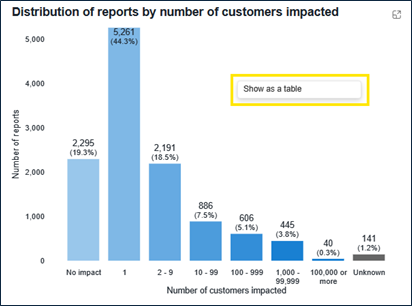
Show as table
Right click on a chart and select ‘Show as table’ to display the selected data as a table. Click ‘Back to report’ from the ‘Show as table’ page to go back to the dashboard.
About the dashboard
Dashboard scope and methodology
How granular is the data in the dashboard?
This dashboard contains aggregated, industry-level data about certain reportable situations reports submitted to ASIC by licensees. It does not name licensees, but provides breakdowns by the products, issues and reporting period of the breaches. For high-level insights into the number and type of licensees who have reported to ASIC, see Additional data.
What scope of reportable situations are included in the dashboard?
ASIC has a legal obligation to publish data about certain reportable situation reports and the entities who submitted them under s912DAD of the Corporations Act (for Australian financial services licensees) and s50D of the National Consumer Credit Protection Act (for credit licensees). Specifically, ASIC is required to publish information about the reportable situations reports lodged with us and the Australian Prudential Regulation Authority (APRA) each financial year about:
- significant breaches of core obligations, or
- situations where the licensee is no longer able to comply with a core obligation and the breach, if it occurs, will be significant (likely significant breaches).
The following reports are outside the scope of ASIC’s data publication obligation and have been excluded from this dashboard:
- reports that are only about additional reportable situations (gross negligence and serious fraud)
- reports about investigations that have not yet concluded that a significant breach or likely significant breach of a core obligation has occurred or will occur
- reports about investigations that have concluded that a significant breach of a core obligation did not or will not occur
- reports made about unrelated licensees
- a small number of reports that were made in error (e.g. duplicates, where the wrong form was used, or where the report was submitted under the wrong licensee), and
- reports submitted by licensees who are individuals or submitted on behalf of a related licensee who is an individual.
The following reports are within the scope of ASIC’s data publication obligation, but have been excluded from the dashboard, for details on these reports see Additional data:
- reports that would have been viewable at an individual report-level, and
- reports submitted directly to APRA under the APRA Dual Reporting Framework.
What period does the dashboard cover?
This dashboard includes data related to reports and their updates with an initial submission date between 1 July 2024 and 30 June 2025 (FY24/25).
Data will be updated annually to reflect new reports and updates submitted in each financial year. Under the data publication obligation, ASIC is required to publish reportable situations data for each financial year within four months of 30 June. This means the dashboard will be updated by 31 October each year.
Data from financial years prior to FY24/25 can be found in thematic reports published by ASIC each year since the introduction of the regime in October 2021 (see Reportable situations insights | ASIC).
What is the difference between a ‘report’, ‘reportable situation’, and ‘breach’?
The term ‘reportable situation’ is defined in s912D of the Corporations Act and s50A of the National Credit Act and describes those matters that a licensee must report to ASIC. The data publication obligation only requires ASIC to publish information on reports about reportable situations that are significant breaches and likely significant breaches of core obligations. Throughout the dashboard, when we use the terms ‘breaches’ and or ‘reportable situations’, we are referring only to these specific types of reportable situations.
The number of ‘reports’ submitted is different from the number of reportable situations. We allow licensees to notify ASIC of multiple reportable situations by lodging a single report. Due to this, a single report could involve:
- one reportable situation (e.g. a single occasion where a licensee’s employee provided incorrect information to a customer), or
- many thousands of reportable situations (e.g. a system error causing thousands of customers to be overcharged, which might also involve breaches of multiple legal provisions).
To date, licensees have adopted differing approaches to calculating and reporting the number of reportable situations. For this reason, as well as to ensure comparability with the methodology used in previous publications where we did not include the number of reportable situations, we have published the number of reports as opposed to the number of reportable situations.
How are reports and updates about reports treated?
ASIC’s Regulatory Portal (see: ASIC Regulatory Portal access | ASIC) allows licensees to submit an initial reportable situation report, as well as updates with new information about the initial report.
The primary concept used throughout the dashboard is ‘reports’; it represents the count of initial reports submitted to ASIC. Where there have been one or more updates to a report, our approach is to count the report only once, but to take data for that report from only the most recent update (see examples below). The initial submission date is used to determine the relevant reporting period for a given report.
To see a count of updates submitted by licensees please see Additional data.
Example 1: Increase in customers impacted by a breach
- a licensee submits a report about a significant breach of a core obligation on 1 September 2024, which is within the publication scope. The report indicates that two customers have been impacted by the breach.
- the licensee submits an update to the report on 25 May 2025, which updates the customer impact number to 150.
- the report would be included in the dashboard as part of the September 2024 reports, in line with its initial submission date. The customer impact reported would be 150, as it would be drawn from the most recent update received on 25 May 2025.
- the count of ‘reports’ in FY24/25 would be one.
Example 2: Updates to reports outside of reporting period
- a licensee submits a report about a significant breach of a core obligation on 20 January 2024.
- on 3 October 2024 the licensee submits an update to that report.
- since the initial lodgement submission date is prior to 1 July 2024, the report is not within the publication scope, and therefore the report would not be included as part of the dashboard (even though one of its updates was submitted in the FY24/25 period).
How will previous years’ figures be impacted when the dashboard is updated each year?
The use of data from the latest update submitted by a licensee means that some data points from previous financial years may change when the dashboard is updated annually. These changes are generally driven by progress made by the licensee in investigating, rectifying and remediating the breach, and/or further information discovered by the licensee in the process of investigating the matter (see examples below).
Example 1: Updates to reports included in past publications
- in FY24/25, a licensee submits an initial report about a reportable situation which resulted in an estimated $150,000 in financial loss to customers, and indicated that they had not yet begun compensation.
- in FY25/26, the same licensee submits an update confirming they have progressed compensation and paid $130,000 to affected customers; the update also adjusts the estimated customer loss figure to $200,000.
- as a result, in the FY24/25 data release this report will be recorded as having zero compensation paid. However, when the dashboard is updated with FY25/26 data, the amount of compensation paid for reports submitted in FY24/25 will show as $130,000 and the total customer financial loss amount would change by $50,000 (from $150,000 to $200,000).
Example 2: Updates that result in inclusion in the publication scope
- in FY24/25, a licensee submits an initial report about an investigation that has not yet concluded that a significant breach has occurred. In FY25/26 they submit an update to say that after further investigation, they have discovered that a significant breach has occurred impacting 100 customers and estimate that the investigation will take 200 days.
- in the FY24/25 release this report would not have been included in any measures, as investigations which have not concluded whether or not a significant breach has occurred are not part of ASIC’s reporting obligation.
- however, when the dashboard is updated with FY25/26 data, the report would be included as one report under the FY24/25 reports. The FY24/25 values for customer impact, investigation timeframes and other measures would be adjusted to include the values reported in the update provided in FY25/26.
Understanding the reportable situations regime
What is the reportable situations regime?
The reportable situations regime (formerly known as breach reporting) is a cornerstone of the financial services and credit regulatory regimes. It requires Australian financial services and credit licensees to self-report to ASIC matters known as ‘reportable situations’. Reportable situations include significant breaches and likely significant breaches of core obligations (together, ‘breaches’) as well as other matters, such as ongoing investigations into potential breaches, and instances of serious fraud and gross negligence.
The requirement to report to ASIC encourages licensees to rectify and remediate issues in a timely manner. Licensees have a clear role in lifting financial industry standards, and part of this responsibility is the efficient identification of their own problems.
The reports we receive are a critical source of regulatory intelligence for ASIC. Among other things, ASIC uses reportable situations reports to:
- identify and address emerging trends of non-compliance in the industry, and
- detect significant non-compliant behaviours and take regulatory action where appropriate.
Full details of the regime can be found in Regulatory Guide 78 Breach reporting by AFS licensees and credit licensees (RG 78).
What is ASIC’s data publication obligation?
ASIC has a legal obligation to publish data about certain reportable situations reports and the entities who submitted them, under s912DAD of the Corporations Act and s50D of the National Credit Act. The data must be published within four months after the end of each financial year (i.e. by 31 October each year). ASIC’s publication of this data supports the objectives of the reportable situations regime as stated in paragraph 11.129 of the Explanatory Memorandum to the Financial Sector Reform (Hayne Royal Commission Response) Bill 2020:
- enhance licensee accountability and provide incentives for improved behaviour,
- help licensees and consumers identify areas where substantial numbers of significant breaches are occurring, and
- allow licensees to target their efforts to improve their compliance outcomes in those areas.
Enquiries
What do I do if I encounter issues with the dashboard?
To contact ASIC regarding any issues or concerns with the dashboard please use ASIC's online enquiry form. To ensure your enquiry is directed to the appropriate team, please select that your question is about a ‘Credit licensee’ or ‘Australian Financial Services licensee’ then select ‘RS dashboard’ from the list of options for “What you would like to know how to do”.
How to interpret the data
Interpreting volume and impact metrics
Report counts in the dashboard may not reflect the magnitude and impact of the reported breaches. As discussed in About the dashboard, licensees may choose to submit one report about an individual reportable situation if only one customer was impacted, or if there were multiple related situations in which thousands of customers were impacted.
Further, a large number of RS reports associated with a particular product or issue does not necessarily suggest a higher incidence of non-compliance, but may in fact reflect stronger compliance systems that can effectively identify and record non-compliance. Reporting volumes as well as measures of customer impact and loss can also be driven by licensee size, business models and reporting practices.
Interpreting timeframe metrics
A reasonable timeframe for each of the measures listed below can depend on a number of factors, including:
- the time taken to start and complete an investigation – can depend on the nature and complexity of a breach, the availability of data and/or contact information for customers, the size of the licensee, its approach to investigations, and reporting practices
- the time taken to complete rectification – can depend on the nature, complexity, and root cause of the matter, the size and processes of the licensee, along with reporting practices, and
- the time taken to finalise compensation of customers – can depend on the nature and complexity of the matter, the size of the licensee, the availability of data, the number of affected consumers, the quality of contact and payment information, and reporting practices.
Interpreting compensation metrics
For reports where compensation has been finalised, the total amount of customer financial loss may not equate to the amount of compensation paid to date due to various factors, including that:
- compensation amounts could include goodwill payments
- the breach may have involved a third-party error for which responsibility to compensate did not fall on the licensee, or
- compensation may be paid to charities where financial impact was very low (e.g. under certain thresholds set out in RG 277), and/or when money could not be returned to customers despite reasonable endeavours to do so.
The treatment of the above factors in reporting compensation and financial loss amounts may differ across licensees.
The use of estimates
The following metrics may include estimates where a licensee has not yet completed their investigation of a reported breach:
- number of customers impacted
- customer financial loss amount
- time taken to discover reported breach
- time taken to complete investigation
- time taken to complete rectification, and
- time taken to finalise compensation.
For details on how specific measures in the dashboard were calculated see the Data dictionary.
Additional data
Reports that could be viewed at an individual report-level
136 reportable situations reports submitted by 76 licensees were excluded from this year’s dashboard as they could be viewed at an individual report-level. These reports may be included in the dashboard in future years.
All level 1 product types were affected by the reports, with life insurance (23 reports) and deposit taking (21 reports) the most frequently cited. The breaches in these reports impacted 5.4 million customers, with a mean of 51,362 customers impacted per report with customer impact. The breaches resulted in $9.2 million in customer financial loss ($187,438 in mean loss per report with financial loss).
To date, the licensees had paid $7.5m in compensation to 4,119 customers. 40% of reports requiring compensation took 30 days or less to finalise compensation after the breach was first discovered, while 8% took longer than 1 year to compensate (compensation timeframes may include estimates where compensation is not yet completed).
Number of reports and updates
Including the 136 reports discussed above, ASIC received a total of 12,001 reports over FY 24/25. In addition, ASIC received 6,485 updates to reports, of these 3,423 were updates to reports submitted in previous financial years and 3,062 were updates to reports submitted in FY24/25.
The size and type of licensees who reported to ASIC
The tables below provide insights into the number and size of the AFS licensees and credit licensees who submitted a report to ASIC over FY24/25. The 136 reports discussed above are included in these tables.
Table 1: Breakdown of AFS licensee reporting by size, based on Form FS70 lodgements
|
Total revenue |
Number of licensees that submitted an RS report |
Percentage of licensees that submitted an RS report |
Number of RS reports |
Percentage of RS reports |
Percentage of total AFS licensee population |
Percentage of revenue reported by AFS licensee population |
|
Less than $50m |
648 |
69.7% |
2,096 |
26.5% |
12.5% |
23.7% |
|
$50m–$249m |
152 |
16.3% |
1,074 |
13.6% |
51.4% |
55.3% |
|
$250m–$999m |
46 |
4.9% |
1,034 |
13.1% |
54.8% |
53.2% |
|
$1,000m or more |
39 |
4.2% |
3,644 |
46.1% |
76.5% |
88.9% |
|
No revenue figure available |
45 |
4.8% |
61 |
0.8% |
5.5% |
- |
|
Total |
930 |
100% |
7,909 |
100% |
14.4% |
80.0% |
Table 2: Breakdown of credit licensee reporting by size, based on Form CL50 lodgements
|
Total credit |
Number of licensees that submitted an RS report |
Percentage of licensees that submitted an RS report |
Number of RS reports |
Percentage of RS reports |
Percentage of total credit licensee population |
|
Less than $200m |
65 |
37.1% |
160 |
3.5% |
1.6% |
|
$200m–$1,799m |
60 |
34.3% |
281 |
6.2% |
30.3% |
|
$1,800m or more |
49 |
28.0% |
4,072 |
90.2% |
71.0% |
|
No credit value available |
1 |
0.6% |
1 |
0.0% |
0.4% |
|
Total |
175 |
100% |
4,514 |
100% |
3.9% |
Note 1: The licensee size information is based on the revenue, including tax benefit, specified in the latest Form FS70 lodgement by the relevant AFS licensees, and the credit value specified in the latest Form CL50 lodgement by the relevant credit licensees as at 30 June 2025. Where data was not available for the most recent financial year, we used data about financial years from 1 July 2021 onwards.
Note 2: A licensee may be classified as ‘No revenue figure available’ or ‘No credit value available’ for a number of reasons, including that as at 30 June 2025 ASIC had not received any Form FS70 lodgements or Form CL50 lodgements about the financial years from 1 July 2021 onwards, or the licensee is exempt from lodging.
Note 3: The ‘Percentage of total licensee population’ figures are calculated as the number of licensees who submitted an RS report as a percentage of the total number of licensees within each size bucket that had a status of ‘Current’ as at 30 June 2025 in ASIC’s AFS licensees register or credit licensees register.
Note 4: The ‘Percentage of revenue reported by licensee population’ figures are calculated as the revenue of licensees who submitted an RS report as a percentage of the revenue reported by all AFS licensees within each size bucket that had a status of ‘Current’ as at 30 June 2025 in ASIC’s AFS licensees register.
Reports submitted to APRA
A small number of reports about reportable situations made by entities who are regulated by both APRA and ASIC are submitted directly to APRA via the APRA dual reporting framework. These reports are not included in the dashboard.
Over FY24/25, eight reports about reportable situations that fell within the scope of ASIC’s reporting obligation were submitted to APRA by six RSE licensees (trustees of superannuation funds). To date, these licensees have reported that the breaches impacted 1.1 million customers and resulted in $284,132 in financial loss.
Disclaimers
Data accuracy
The data in this dashboard is self-reported by licensees and not assured by ASIC and is subject to the constraints of the various recording and reporting practices of licensees which are not controlled by ASIC.
To aid in transparency, the reportable situations data has been published as it was reported to ASIC. ASIC does not verify that the data reported (or not reported) by licensees accurately reflects their progress in identifying, rectifying and remediating breaches.
Licensees can update and correct data in the dashboard by submitting an update report to ASIC through our Regulatory Portal. The dashboard will be refreshed annually, and as outlined on About the dashboard, any updates will be reflected in the refreshed data.
Not advice
Dashboard users should not use the data presented in this dashboard as the sole basis for making financial decisions. Consumers should seek advice before making any financial decisions. To the extent permitted by law, ASIC does not warrant the accuracy of the data presented in this dashboard and accepts no liability for any losses arising out of improper use, or release of information in the dashboard.
Nature of reports
Licensees are required to report to ASIC when they have reasonable grounds to believe that a reportable situation has occurred. However, a report submitted to ASIC does not amount to a determination of liability made by ASIC or other authority such as a court.
Privacy
ASIC has taken steps to protect personal and sensitive information reported through reportable situations reports, including by removing any free text fields from the publication. If you have any concerns about the handling of personal information in the publication, please use ASIC's online enquiry form to contact us. Visit https://www.asic.gov.au/privacy for further information on how ASIC handles personal information.
Data Dictionary
Key terms
AFS licence – An Australian financial services licence under s913B of the Corporations Act 2001 that authorises a person who carries on a financial services business to provide financial services.
Note: This is a definition contained in s9 of the Corporations Act 2001.
AFS licensee – A person who holds an AFS licence under s913B of the Corporations Act 2001.
APRA – Australian Prudential Regulation Authority.
ASIC – Australian Securities and Investments Commission.
ASIC Regulatory Portal – The internet channel that allows authenticated regulated entities to interact securely with ASIC, accessible on the ASIC Regulatory Portal landing page.
Breach – In this dashboard, an incident or event within a licensee’s organisation that has amounted to one of the following types of reportable situations:
- significant breaches of core obligations, or
- situations where the licensee is no longer able to comply with a core obligation and the breach, if it occurs, will be significant.
Compensation – In this dashboard, a type of remediation which involves returning customers who have suffered financial loss as a result of a breach to the position they would have otherwise been in through the use of monetary payments.
Core obligation – The general obligations of AFS licensees and credit licensees. For a summary of the core obligations for AFS licensees and credit licensees, see Appendix 1 of RG 78.
Corporations Act – Corporations Act 2001 (Cth), including regulations made for the purposes of that Act.
Credit licence – An Australian credit licence under s35 of the National Consumer Credit Protection Act 2009 that authorises a licensee to engage in particular credit activities.
Credit licensee – A person who holds an Australian credit licence under s35 of the National Consumer Credit Protection Act 2009.
Financial year – The period from 1 July to 30 June.
FY24/25 – For example, the financial year that falls within 1 July 2024 to 30 June 2025, inclusive.
Initial submission date – The date a report was initially submitted to ASIC.
Investigation – In this dashboard, the process that a licensee conducts to determine the root cause of that breach and identify all customers affected and the extent of customer impact.
Licensee – An AFS licensee and/or credit licensee.
Likely breach – Also referred to as a likely significant breach, is a situation where a licensee or a representative of the licensee is no longer able to comply with a core obligation and the breach, if it occurs, will be significant.
Note: See s912D(1)(b) of the Corporations Act or s50A(1)(b) of the National Consumer Credit Protection Act.
National Credit Act – National Consumer Credit Protection Act 2009 (Cth).
Prevention – A process undertaken by a licensee to prevent re-occurrence of the breach.
Preventative measures – The measures a licensee undertakes to reduce the likelihood of a breach re-occurring.
Rectification – A process undertaken by a licensee to fix the root cause of a breach.
Remediation – A process, large or small, to investigate the scope of the misconduct or other failure and, if appropriate, return consumers who have suffered loss as a result of the misconduct or other failure to the position they would have otherwise been in, as closely as possible. This could be by way of monetary and/or non-monetary remedies (for further guidance please see RG 277: Consumer Remediation).
Report(s) – A report about a reportable situation/s. Does not include updates to reports.
Reports with previous similar reportable situations – Reports determined by the licensee as similar to a previously reported reportable situations based on factors such as the nature of the issue and breach, the legislative provision contravened, root cause, type of controls in place, and customer impact.
Reportable situation – Has the meaning given by s912D of the Corporations Act 2001 or s50A of the National Consumer Credit Protection Act 2009.
RG 78 (for example) – An ASIC regulatory guide (in this example numbered 78).
s912D (for example) – A section of the Corporations Act (in this example numbered 912D).
Dashboard measures
Below are the definitions and calculations of the key measures used throughout the dashboard. The calculations are derived from the questions that licensees are required to answer when submitting a reportable situations report through the ASIC Regulatory Portal. For the full list of questions see the Form design mapping document (we have provided the control ID for each question in the document to enable ease of use).
Key insights and trends
This page provides high-level insights into breaches reported by licensees including the volume and nature of breaches, the extent of their impact on customers, and the progress licensees have made investigating, remediating and rectifying those impacts.
Volumes and significance reasons
This page allows users to explore trends over time in the number of reports about breaches submitted by licensees, as well as the reason/s those reports were considered significant.
Customer impact and loss
This page allows users to explore the customer impact of breaches reported by licensees, including the number of customers affected and any financial loss, or non-financial losses (such as delays or poor customer experience) suffered.
Please note that these measures may include estimates provided by a licensee where an investigation is not yet complete.
Nature of breaches
This page allows users to explore the types of breaches reported by breaking down total reports by product, issue and root cause.
Nature of breaches over time
This page allows users to explore trends in the types of breaches reported over time by breaking down total reports by product, issue and root cause.
Warning: When viewing products at levels 2 and 3 and issues at level 2, we recommend filtering to a particular level 1 product and/or issue using the page filters. The large number of categories contained within each of these levels cannot all be shown in the charts at one time. The slider button on the y-axis of each chart can also be used to zoom in or out of the charts.
Identification of breaches
This page allows users to explore how quickly licensees are identifying breaches, and to understand the trigger that made licensees aware of the matter, or start their investigation.
Investigation of breaches
This page allows users to explore licensees’ progress and timeliness in commencing and finalising investigations into the cause and impact of breaches. Timely investigations reduce the risk of continuing or recurring breaches by identifying the root or systemic cause of the breach; they also enable quicker remediation.
Rectification of breaches
This page allows users to explore licensees’ progress in rectifying the underlying cause of a breach and implementing preventative measures to reduce the likelihood of the breach re-occurring. It also provides details on the types of rectification methods used by licensees.
Remediation of impacted customers
This page allows users to explore licensees’ progress in compensating customers, as well as the types of remediation provided to customers. Remediation may take the form of monetary payments (compensation), or other non-monetary remedies such as a change in contract terms or an apology.