This is Information Sheet (INFO 177). It is designed to help with the interpretation of our quarterly cash equity market data. It provides definitions of important concepts and explains the methodology used for the statistics provided.
Equity market statistics reported
ASIC receives equity market data through our market surveillance system. This system captures all orders and trades in Australian equity market products and is the primary source of equity market statistics reported by ASIC.
Data reported covers all ASX-listed equity market products, as defined in ASIC Market Integrity Rules (Securities Markets) 2017 (Securities Markets Rules). Unless otherwise stated, the statistics cover all orders and trades, including those outside the normal opening time for exchanges, with the exclusion of booking purpose trades and the exercise of put options and call options.
For a detailed explanation of the key terms used in this information sheet, see ‘Key terms’ in Regulatory Guide 265 Guidance on ASIC market integrity rules for participants of securities markets (RG 265).
Table 1 lists the statistics provided in our quarterly cash equity market data.
Table 1: Statistics provided in our quarterly cash equity market data
|
Statistics |
Market characteristics |
|---|---|
|
Number of trades and dollar value traded |
Indicates aggregate activity in the market |
|
Market share of trades and dollar value traded |
Indicates the composition of trading across different execution venues and modes of trading (with or without pre-trade transparency) |
|
Index of market concentration in Australia |
Shows concentration – and by extension, fragmentation – in the market. A measure of concentration for the total market and public venues is provided. |
|
Order-to-trade ratio |
Often used as a proxy for the degree of automation on exchanges and the degree of ‘noise’ in the market |
|
Volatility |
Shows trends in price variation on both an intraday and interday basis |
|
Statistics |
Market efficiency |
|---|---|
|
Effective bid-ask spreads |
Describes the cost of accessing immediate liquidity – one component of the overall cost of trade |
|
Quoted bid-ask spreads |
Describes the average spread displayed on lit exchanges |
|
Depth at best bid and ask |
Indicates the amount of passive liquidity available at the best bid and ask prices throughout the day |
Market characteristics: Definitions and methodology
Execution venues
Trades executed on or reported to execution venues are detailed in Table 2.
Table 2: Details of trade types by execution venue
|
Category |
Definition |
|---|---|
|
ASX on-order book |
All trades executed on ASX TradeMatch with the exception of auction trades |
|
ASX auctions |
Trades executed at the open, closing or intraday auctions |
|
ASX Centre Point |
Trades executed from ASX Centre Point order book |
|
ASX trade reporting |
All prearranged crossings reported to ASX. This includes block size trades, large portfolio trades, price improvement trades and out-of-hours trades |
|
Chi-X on-order book |
All trades executed on the Chi-X order book, including from hidden orders |
|
Chi-X trade reporting |
All prearranged crossings reported to Chi-X. This includes block size trades, large portfolio trades, price improvement trades and out-of-hours trades |
Average trade size
This is the total value traded divided by the number of trades. A large order that executes in a number of smaller trades is counted as multiple trades, thereby reducing the calculated average trade size for a particular security or execution venue.
Dark liquidity
Dark liquidity refers to orders and trading activity that rely on pre-trade transparency exceptions under Part 6.2 of the Securities Markets Rules. Such trades, known as ‘dark trades’, can occur on exchange markets (e.g. ASX’s Centre Point and hidden orders on Chi-X’s order book) and in venues other than exchange markets. Rather than routing an order to a market, a market participant may choose to fill the order from its own inventory (known as internalisation) or may choose to ‘cross’ it with other client orders.
The statistics on dark trading represent the proportion of total value traded. Statistics are provided for two categories:
- Block size trades – this includes trades executed under the pre-trade transparency exceptions in Rule 6.2.1 (block trades) and Rule 6.2.2 (large portfolio trades) of the Securities Markets Rules. These trades are typically in excess of varying thresholds between $200,000 and $1 million from 26 May 2013.
- Below block size trades – this includes trades that are executed without pre-trade transparency and not captured under Rules 6.2.1 or 6.2.2 of the Securities Markets Rules. These trades must be executed within the national best bid and offer (NBBO).
Order-to-trade ratio
This is the total number of submitted messages (i.e. orders that are newly entered, amended or deleted) as a ratio of the total number of trade messages. It is used interchangeably with the term ‘message-to-trade ratio’.
If a marketable order executes in multiple trades, this is captured as the total number of trades recorded.
Trading profile
The trading profile captures changes in activity by mapping the value and number of trades matched ‘on-order book’ (the ASX TradeMatch, ASX Centre Point or Chi-X order books) throughout the day. Trades executed in the ASX auction are also included.
Market volatility
The volatility indicators measure the standard deviation of logarithmic price changes (midpoint prices) per security per minute and over five minutes (intraday) and for closing prices per day (interday). For the intraday volatility measure, the daily standard deviation for each security is averaged over the period. The interday measure reports the standard deviation of logarithmic price changes (closing price to closing price) over the month. Volatility is calculated as:
![]()
Vol is then weighted by turnover across securities.
This provides an indication of the variability of price changes in the market and the potential degree of risk in executing trades.
Market concentration: Definitions and methodology
The Herfindahl–Hirschman index (HHI) is a measure of market concentration defined as the sum of the squares of the market shares (expressed as fractions) of execution venues. In practice, the index can range from close to zero (denoting a highly fragmented market – that is, a market composed of many small venues) to one (a monopoly). For a market with n venues the index is calculated as:
![]()
We provide two series, which represent the concentration of all execution venues and the concentration of publicly accessible execution venues:
- Total market HHI – this includes ASX on-order book (including auctions and excluding ASX Centre Point), ASX Centre Point, Chi-X on-order book, and each market participant’s total crossing turnover (i.e. crossings matched by market participants are considered separate execution venues for this measure).
- Public order book HHI – this represents the concentration of liquidity that is available and accessible for all investors. This includes ASX TradeMatch on-order book (including auctions), ASX Centre Point and Chi-X on-order book. Trades matched by market participants and reported to a market are not included in this calculation.
Market efficiency: Definitions and methodology
There are a number of measures of market efficiency. These have been reported as a turnover weighted average for all equity market products and for the top 200 securities by turnover. These averages and the list of the top 200 securities by turnover are computed monthly.
Weightings
For all measures of market efficiency, calculations are performed on a per security per day basis. The average observations at an individual security level are then weighted by turnover (which is also referred to as ‘traded value’) across securities to provide market-wide indicators. This captures the relative importance of different securities, thereby placing greater emphasis on those securities that are more actively traded.
Spreads are reported in basis points (bps) where 1 bp equals 0.01%.
Quoted bid–ask spreads
The quoted bid–ask spread provides an indication of the average cost of accessing passive liquidity throughout the day. It is measured as the average difference between the best (lowest) ask price and the best (highest) bid price divided by the prevailing midpoint price measured across ASX and Chi-X markets. The market is sampled every minute during continuous trading hours with the average spread per security reported on a daily basis. For every security and for every minute during trading hours:
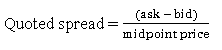
The quoted spread is then averaged across time and turnover weighted across securities.
Effective bid–ask spread
The effective spread represents the actual cost incurred by an aggressive order to immediately access liquidity in the market. For trades where the aggressor is the buyer, which usually occur at the ask price, it is calculated as the difference between the trade price and the prevailing bid price. For trades where the aggressor is the seller, which usually occur at the bid price, it is calculated as the difference between the trade price and the prevailing ask price. This is measured for on-order book trades executed during continuous trading hours (excluding trade reports) and weighted by each trade’s contribution to each security’s turnover. For each trade and for each security:
![]()
The effective spread is then turnover weighted across securities.
Depth
Depth of the order book indicates the amount of passive liquidity available throughout the day.
For quarterly cash equity market data releases from 2020 onwards, depth is measured as the total dollar value of shares available at the best (lowest) ask price and the best (highest) bid price measured across ASX and Chi-X markets. For every security and for every minute during trading hours:
![]()
For quarterly cash equity market data releases prior to 2020, depth is measured as the total number of shares at the first five price steps on each side of the midpoint price divided by the number of shares on issue for each security. For every security and for every minute during trading hours:

Depth is then averaged over time and turnover weighted across securities.
More information
- Read Regulatory Guide 265 Guidance on ASIC market integrity rules for participants of securities markets.
- Contact ASIC.
Important notice
Please note that this information sheet is a summary giving you basic information about a particular topic. It does not cover the whole of the relevant law regarding that topic, and it is not a substitute for professional advice. We encourage you to seek your own professional advice to find out how the applicable laws apply to you, as it is your responsibility to determine your obligations.
You should also note that because this information sheet avoids legal language wherever possible, it might include some generalisations about the application of the law. Some provisions of the law referred to have exceptions or important qualifications. In most cases, your particular circumstances must be taken into account when determining how the law applies to you.
Information sheets provide concise guidance on a specific process or compliance issue or an overview of detailed guidance.
This information sheet was reissued in July 2020.