

Equity market data for quarter ending June 2026
For an explanation of the measures used in this release, see Information Sheet 177 Quarterly cash equity market data: Methodology and definitions (INFO 177).
Summary for Quarter Ending June 2026
Market Share and Turnover
- In the June 2026 quarter, ASX accounted for 83.7% of the total dollar turnover in equity market products, up from 81.9% in the March quarter. Cboe accounted for the remaining 16.3%.
- These figures include all trades executed on order book, as well as trades matched off order book and reported to either market operator.
- Average daily turnover in the Australian equity market was $10.8 billion for the June quarter, a decrease of $0.4 billion from the March quarter.
Turnover Composition (as a proportion of total dollar turnover)
- On order book turnover (excluding ASX auctions) decreased to 56.0% in the June quarter from 58.0% in the March quarter.
- Trade reporting turnover increased to 17.6%, compared to 17.3% in the March quarter.
Market concentration
ASX’s market share, measured by the Herfindahl‑Hirschman Index (HHI) increased to 0.67 in the June quarter from 0.65 in the March quarter (maximum 1.00).
Order-to-trade ratio
The overall ratio decreased to 8.7:1 in the June quarter from 8.9:1 in the March quarter.
Liquidity
- Depth of the order book across the best bid and ask in the June 2026 quarter reached an average of $718,000 across the largest 200 securities and $691,000 across all securities, compared to $507,000 and $491,000 last quarter, respectively.
- Quoted spreads in the June quarter have increased for the largest 200 securities, currently at an average of 11.00 bps from 9.45 bps last quarter. Across all securities, quoted spreads have increased, at 19.75 bps from 17.57 bps last quarter.
- Effective spreads have decreased across the largest 200 securities, at 10.24 bps from 10.29 bps last quarter, and decreased across all equity products, at 18.08 bps in the June quarter from 19.21 bps previously.
Table 1: Market characteristics – average for June quarter 2026
| Statistics | ASX on book | ASX Auctions | ASX Centre Point | ASX trade reporting | Cboe on book | Cboe trade reporting | Total | Change |
|---|---|---|---|---|---|---|---|---|
| Number of trades per day | 2,159,216 | 84,590 | 476,774 | 130,267 | 842,568 | 135,501 | 3,828,916 | ▲ |
| (market share) | 56.4% | 2.2% | 12.5% | 3.4% | 22.0% | 3.5% | 100.0% | |
| Value traded ($ million/day) | 4,313.2 | 2,862.9 | 644.8 | 1,232.4 | 1,099.5 | 796.6 | 10,966.7 | ▼ |
| (market share) | 39.3% | 26.1% | 5.9% | 11.2% | 10.0% | 7.3% | 100.0% | |
| Order-to-trade ratio | 8.0 | na | 6.1 | na | 11.9 | na | 8.7 | ▼ |
| Average trade size ($/trade) | 1,999.6 | 33,824.7 | 1,356.0 | 9,681.8 | 1,305.9 | 6,031.4 | 2,859.0 | ▼ |
Table 2: Measures of market concentration
| Statistics |
Q1 2026 average |
Apr 2026 | May 2026 | Jun 2026 | Change from previous quarter |
|---|---|---|---|---|---|
| Total market | 0.45 | 0.47 | 0.43 | 0.44 | - |
| Public venues | 0.66 | 0.66 | 0.67 | 0.67 | ▲ |
Table 3: Measures of market efficiency
| Market Efficiency Statistics | Q1 2026 average | Apr 2026 | May 2026 | Jun 2026 | Change from previous quarter |
|---|---|---|---|---|---|
| Quoted bid-ask spread (bps) | |||||
| Top 200 securities by turnover | 9.45 | 11.64 | 10.72 | 10.64 | ▲ |
| All Securities | 17.57 | 20.04 | 19.62 | 19.59 | ▲ |
| Effective bid-ask spread (bps) | |||||
| Top 200 securities by turnover | 10.29 | 10.97 | 9.95 | 9.81 | ▼ |
| All Securities | 19.21 | 18.61 | 17.89 | 17.75 | ▼ |
| Best depth ($) | |||||
| Top 200 securities by turnover | 507,141.31 | 926,067.53 | 590,814.03 | 637,435.23 | ▲ |
| All Securities | 490,763.90 | 859,524.06 | 580,048.83 | 632,535.62 | ▲ |
Note: BLD in July 2021, SYD in February 2022, CIM in Mar 2022, MCR in Q2 2023 and ALX in Q2 2026 are excluded when computing depth metrics.
Figure 1: Market share – June quarter 2026
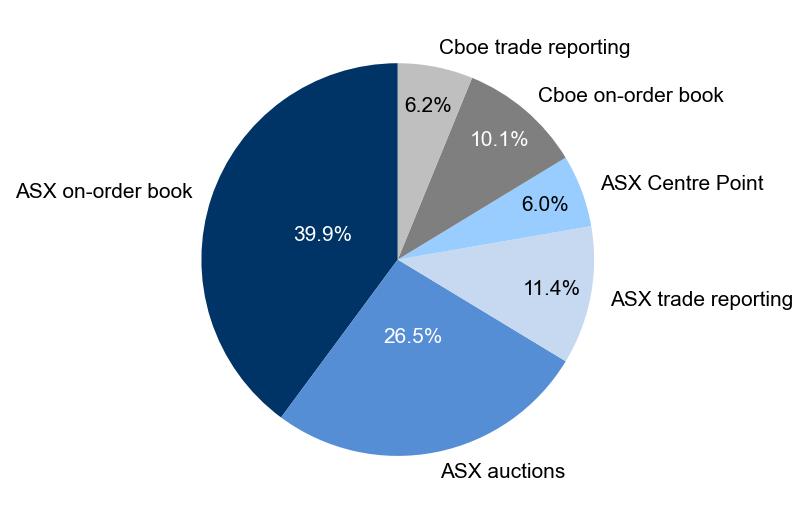
Figure 2: Average daily turnover
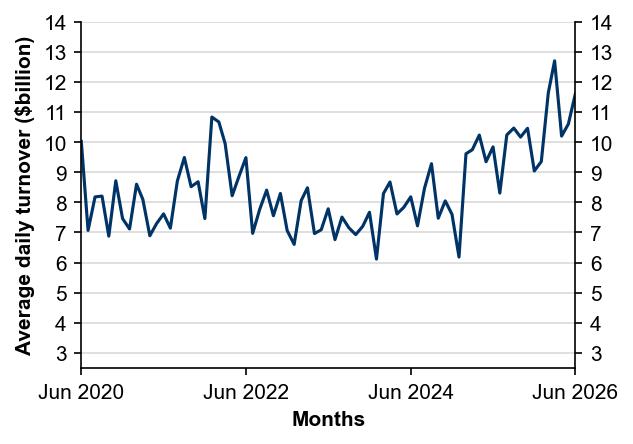
Figure 3: Average trade size by execution venue
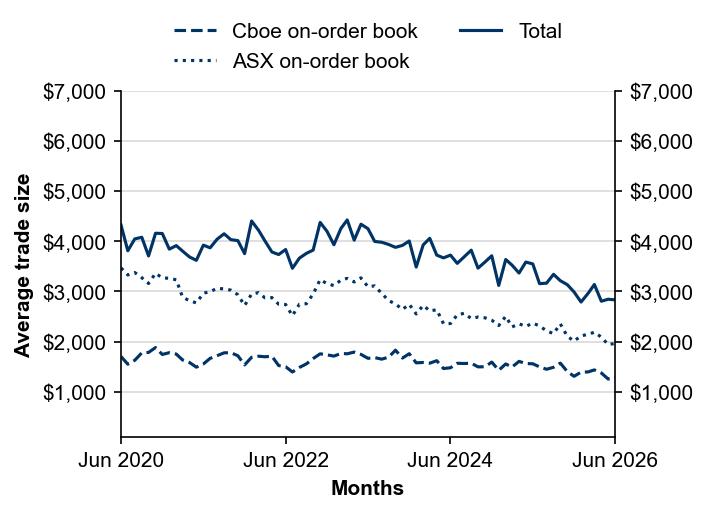
Figure 4: Dark liquidity proportion of total value traded
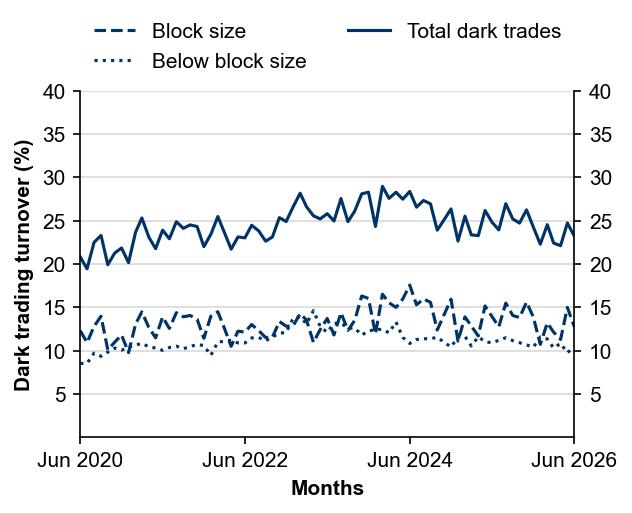
Figure 5: Order-to-trade ratio
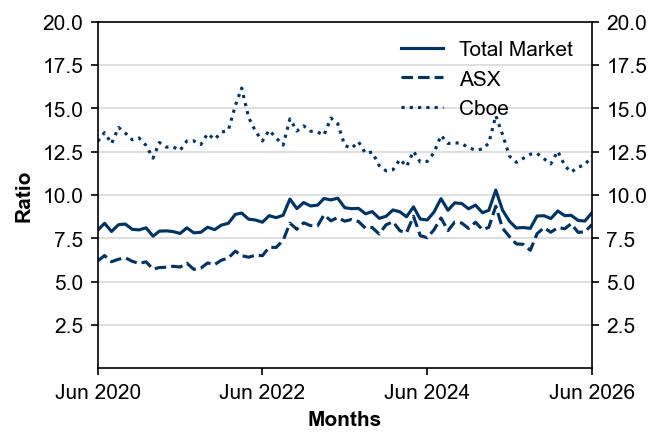
Figure 6: Intraday on-market trading profile – June quarter 2026
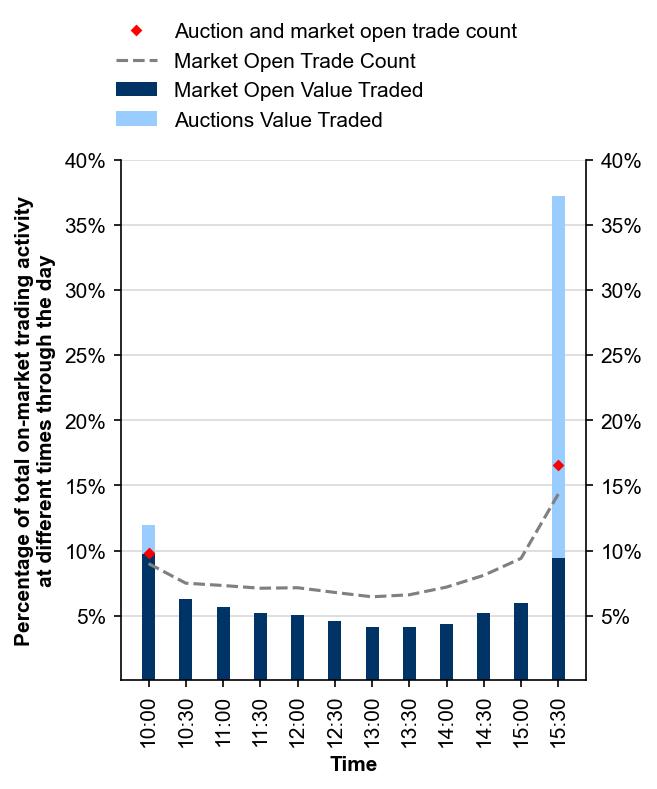
Figure 7: Intraday volatility
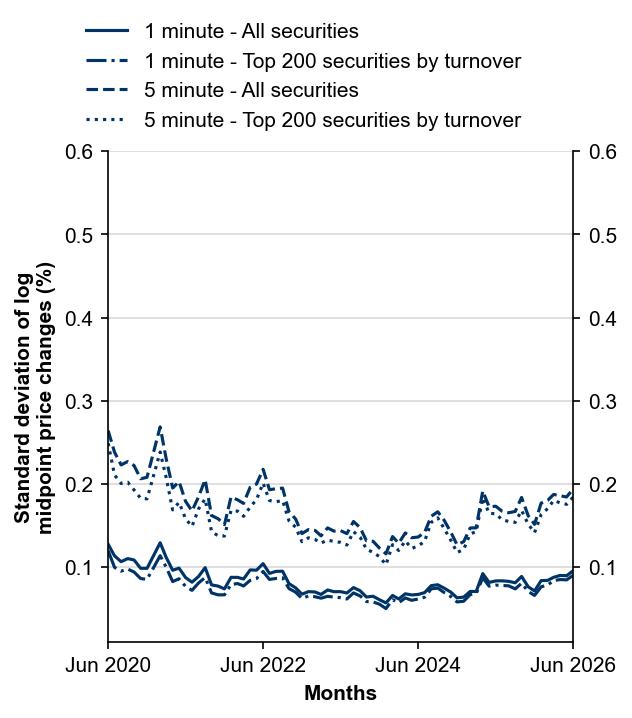
Figure 8: Interday volatility
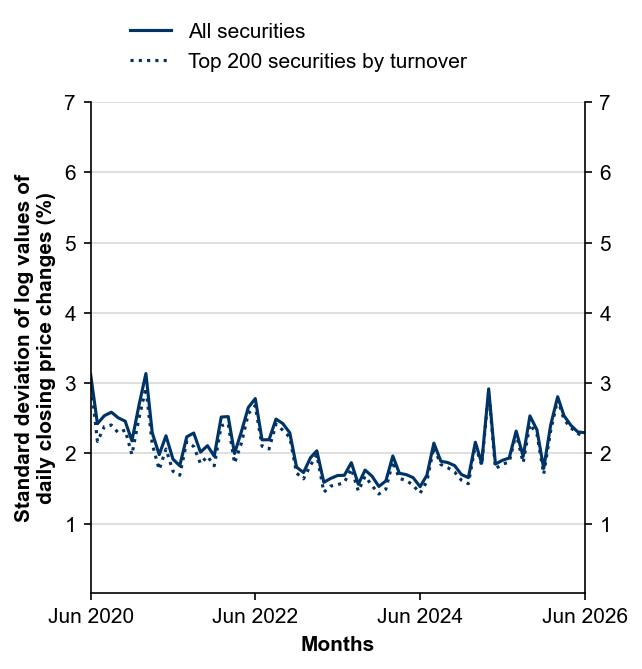
Figure 9: Herfindahl index
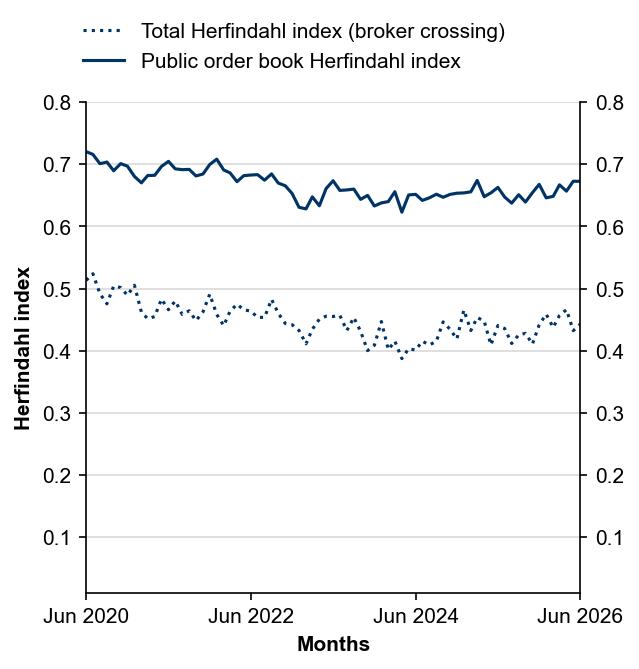
Figure 10: Effective bid-ask spreads
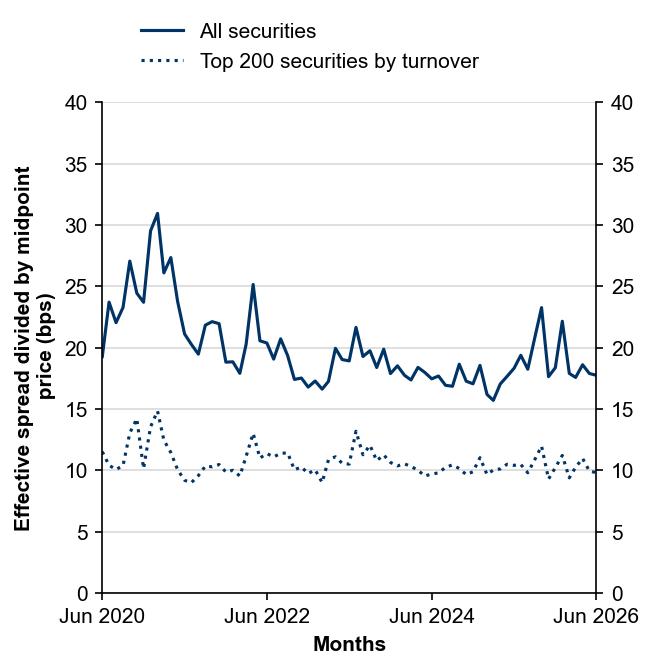
Figure 11: Quoted bid-ask spreads
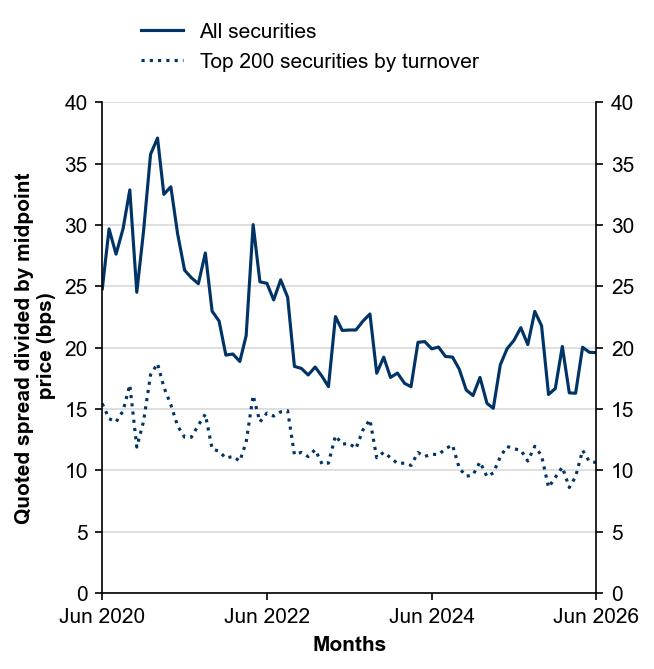
Figure 12: Depth at best bid and ask prices
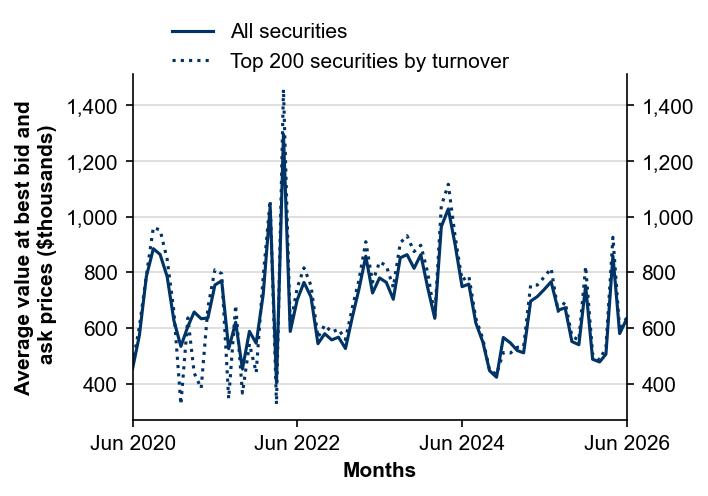
Note: BLD in July 2021, SYD in February 2022, CIM in Mar 2022, MCR in Q2 2023 and ALX in Q2 2026 are excluded when computing depth metrics.