Equity market data for quarter ending September 2014
For an explanation of the measures used in this release, see Information Sheet 177 Quarterly cash equity market data: Methodology and definitions (INFO 177).
Summary
Summary of September quarter data
Tables
Table 1 - Market characteristics - average for September quarter
Table 2 - Measures of market concentration
Table 3 - Measures of market efficiency
Graphs
Figure 1: Market share - September quarter 2014
Figure 2: Australia - Average daily turnover
Figure 3: Average trade size by execution venue
Figure 4: Dark liquidity proportion of total value traded
Figure 5: Order-to-trade ratio
Figure 6: Intraday trading profile
Figure 10: Effective bid-ask spreads
Figure 11: Quoted bid-ask spreads
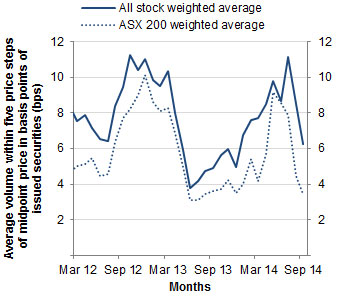
Figure 12: Depth at five price steps as basis points of issued securities
Equity market data from other quarters
Summary of September quarter data
Over the September quarter 2014, the ASX accounted for 82.2% of the total dollar turnover in equity market products. Chi-X accounted for the remaining 17.8% of total dollar turnover. These figures include all trades executed on order book, as well as trades matched off order book and reported to either market operator. Of note, Chi-X trade reporting grew strongly in the past quarter (+28%) although it still lags the value ASX trade reporting.
Overall daily turnover in the equity market averaged $4.9 billion in the September quarter an increase of 6%. The average trade size rose slightly to $5,400. The weighted average quoted bid-ask spread for securities in the ASX200 index decreased marginally to 14.2 basis points of the midpoint price. In contrast, the weighted average quoted bid-ask spread for all securities increased to 22.3 basis points of the midpoint price.
Quarterly average intraday and interday volatility were marginally higher in the quarter. The overall order-to-trade ratio increased to 8.4:1 in the quarter as both the ASX and Chi-X reported higher ratios.
Below block size dark liquidity represented 12% of total value traded in the September quarter, unchanged from the previous quarter, and above its share of the market a year prior (10%). Turnover in block size dark liquidity was 17% of total value traded, slightly up from the previous quarter (16%).
Note: ASIC's market surveillance system was replaced in the second half of 2013. From 1 October 2013, equity market data is obtained from the new surveillance system utilising the existing methodology. Some minor discrepancies exist between the two surveillance systems but these are not significant when examining aggregate market data.
Table 1 - Market characteristics - average for September quarter
| Statistics |
ASX on-order
book |
ASX auctions
|
ASX Centre Point
|
ASX trade
reporting |
Chi-X on-order
book |
Chi-X trade reporting
|
Total
|
|---|---|---|---|---|---|---|---|
| Number of trades per day (market share) |
594,746
(65.9%) |
27,393
(3.0%) |
77,565
(8.6%) |
8,576
(0.9%) |
128,820
(14.3%) |
65,731
(7.3%) |
902,831
(100.0%) |
| Value traded, $ million/day (market share) |
2,453.3
(50.5%) |
687.9
(14.2%) |
286.7
(5.9%) |
561.6
(11.6%) |
380.6
(7.8%) |
485.3
(10.0%) |
4,855.4
(100.0%) |
| Order-to-trade ratio |
6.3
|
na
|
na
|
na
|
16.2
|
na
|
7.7
|
| Average trade size, $/trade |
4,122
|
25,065
|
3,719
|
65,233
|
2,967
|
7,399
|
5,374
|
Table 2 - Measures of market concentration
| Statistics |
September 2013
|
July 2014
|
August 2014
|
September 2014
|
|---|---|---|---|---|
| Total market Herfindahl index |
0.41
|
0.44
|
0.42
|
0.44
|
| Public venues Herfindahl index |
0.73
|
0.70
|
0.69
|
0.70
|
Table 3 - Measures of market efficiency
| Statistics |
September 2013
|
July 2014
|
August 2014
|
September 2014
|
|---|---|---|---|---|
| Quoted bid-ask spread, bps - All stocks - S&P/ASX 200 stocks |
21.2
14.8 |
23.3
14.6 |
21.6
13.9 |
21.9
14.2 |
| Effective bid-ask spread, bps - All stocks - S&P/ASX 200 stocks |
18.2
12.9 |
20.1
12.0 |
18.8
11.5 |
18.8
11.9 |
| Depth at best 5 price steps - all stocks, bps - All stocks - S&P/ASX 200 stocks |
3.6
4.9 |
7.9
11.2 |
4.4
8.5 |
3.5
6.2 |
Figure 1: Market share - September quarter 2014
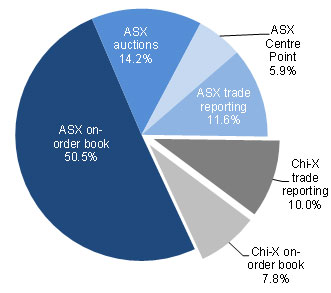
Figure 2: Australia - Average daily turnover
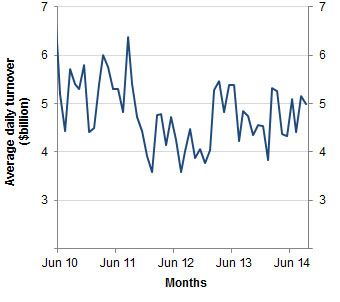
Figure 3: Average trade size by execution venue
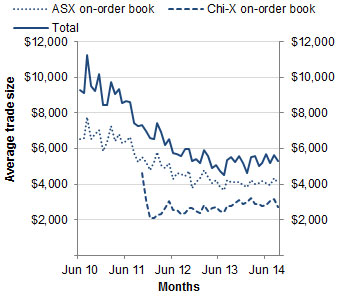
Figure 4: Dark liquidity proportion of total value traded
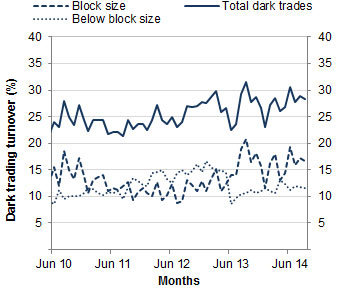
Figure 5: Order-to-trade ratio
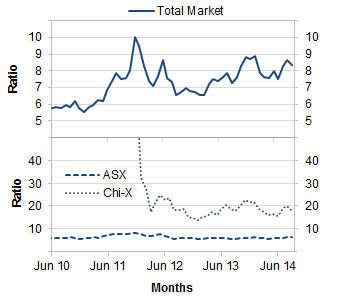
Figure 6: Intraday trading profile - September quarter 2014
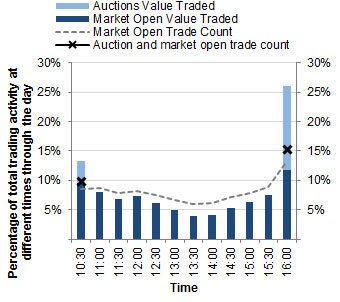
Figure 7: Intraday volatility
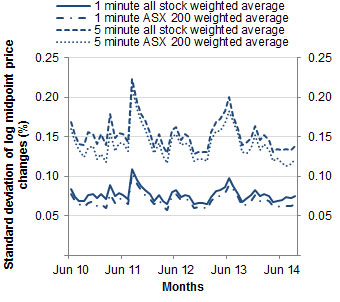
Figure 8: Interday volatility
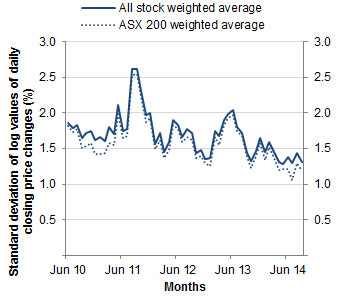
Figure 9: Herfindahl index
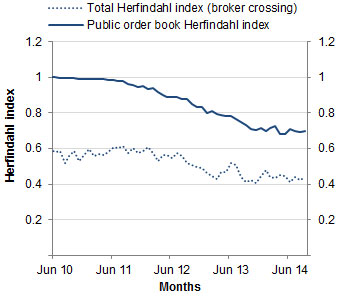
Figure 10: Effective bid-ask spreads
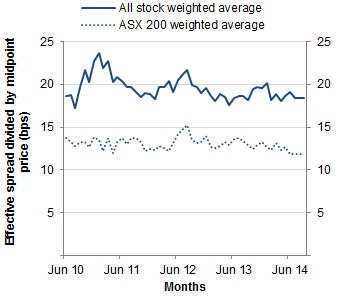
Figure 11: Quoted bid-ask spreads
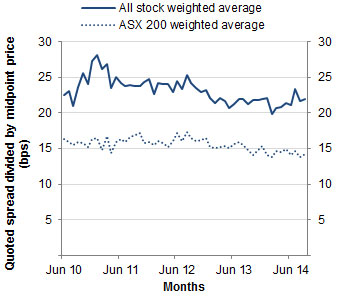
Figure 12: Depth at five price steps as basis points of issued securities